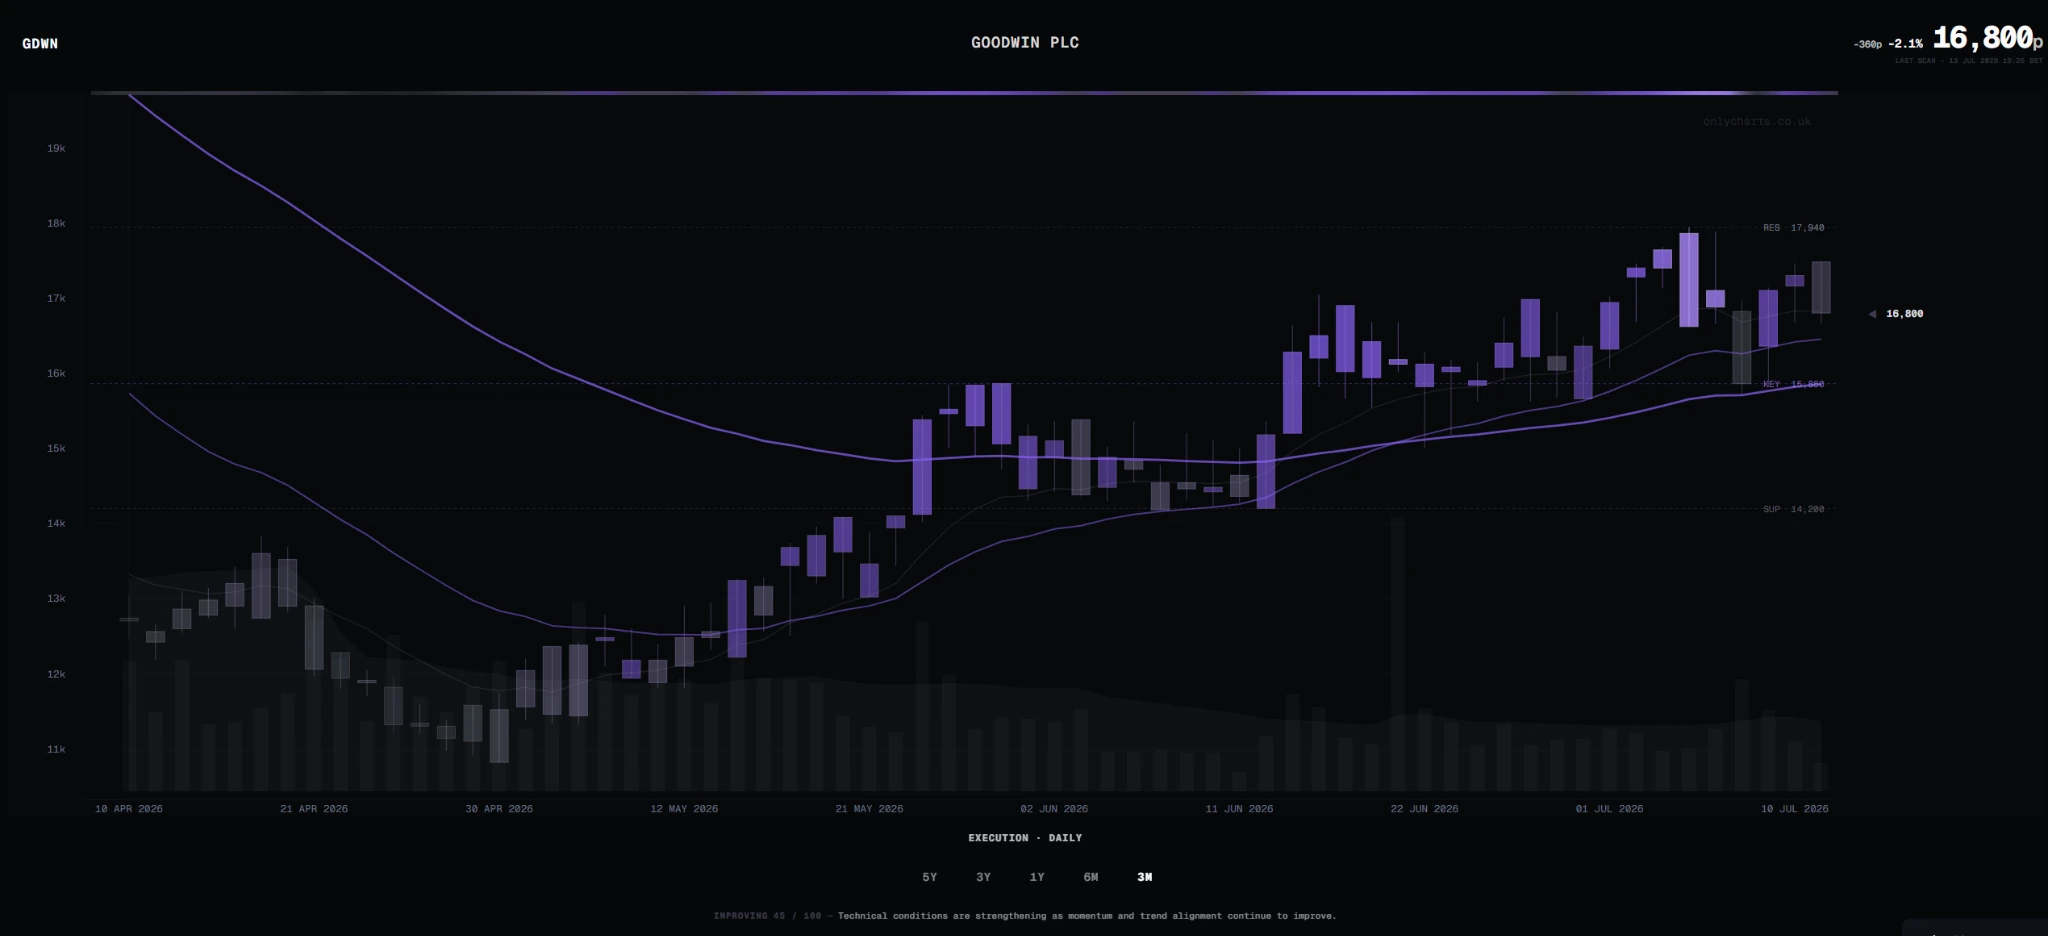
The latest candle is the loudest part of a chart, not necessarily the most important.
Begin with the 5Y Strategic and 3Y Structural views. Ask whether the stock is in a long decline, building a base, recovering through old supply or already extended after a major re-rating. Then move to the 1Y, 6M and 3M views.
Read the trend rails.
A trend rail is context, not a command. OnlyCharts plots the 10, 20 and 50 exponential trend rails to show how current price is aligned with short, medium and slower trend conditions.
On smaller companies, one gap or thinly traded candle can distort a short-term read. Check whether the alignment persists across several bars and whether the longer views agree.
Ask whether pressure is building or fading.
Momentum tells you how the move is behaving, not whether the share is automatically attractive. OnlyCharts uses MACD, its signal line and the histogram to describe whether pressure is accelerating, improving, stable, fading or weakening.
Improving momentum below zero can be the early phase of repair, not confirmation that the chart is strong. Positive momentum can still fade after an extended run. Read the sign, the change and the surrounding trend together.
Give the move the right weight.
Volume gives a price move weight. OnlyCharts compares the latest available volume with the 20-day average and displays relative volume as a multiple.
Light activity reduces the amount of confirmation available from the current bar. Elevated or heavy activity makes the bar more significant, but the direction of price still matters. High volume during a breakdown is very different from high volume through resistance.
A live daily session may be labelled In Progress because the final day’s volume is not yet known.
Read price in relation to the structure.
Price only makes sense relative to where it sits. The X-Ray shows support, a key level and resistance so you can see whether the stock is holding the lower part of its range, reclaiming the level that changes the read or pressing into overhead supply.
Descriptions such as Holding Support, Below Key Level, Above Key Level, Structure Rising, Breakout or Below Support describe the current relationship. They are not promises that a level will hold.
Check whether the stock is actually leading.
A share can rise and still lag a stronger market. OnlyCharts compares the stock’s return with the displayed benchmark over one week, one month and three months.
Longer-window leadership with short-term cooling may represent a pause. Negative readings across all three windows are a materially different condition. Relative strength is most useful when it confirms improving price structure and trend.
Use the diagnosis as the conclusion.
The headline diagnosis is the summary, not the starting point. After reading the evidence, ask whether the score is broadly supported or whether one strong component is compensating for several weaker ones.
A diagnosis of Improving does not mean the work is finished. It often describes a chart in transition: some evidence has turned, while a key level, volume confirmation or longer-term structure remains incomplete.
If the score surprises you, inspect the candle X-Ray. It should show which pillar is doing the work.
Avoid the most common chart-reading mistakes.
- Judging the whole chart from one day or one indicator.
- Calling low price “support” without evidence of buyer behaviour.
- Treating high volume as automatically bullish.
- Ignoring spread and liquidity because the visual chart looks clean.
- Confusing a strong chart with a favourable current entry location.
- Using the diagnosis as a substitute for company research.
A practical order
Context → trend → momentum → participation → structure → relative strength → diagnosis.