01
Technical clarity
See whether a chart is strengthening, weakening or simply not worth deeper research yet.
OnlyCharts helps investors read the technical health of a stock through one consistent framework: trend, momentum, relative strength, volume, structure and price levels in one clean Technical X-Ray.
Most charting platforms show indicators. OnlyCharts helps you understand what those indicators are saying, quickly and consistently.
See whether a chart is strengthening, weakening or simply not worth deeper research yet.
Designed around AIM and UK small caps, with market-aware benchmark comparison and UK-first ticker handling.
Review more charts in less time using the same repeatable technical framework every time.
OnlyCharts compresses trend, score, volume, momentum, relative strength and key levels into a single view, so the chart tells a clearer story without adding clutter.
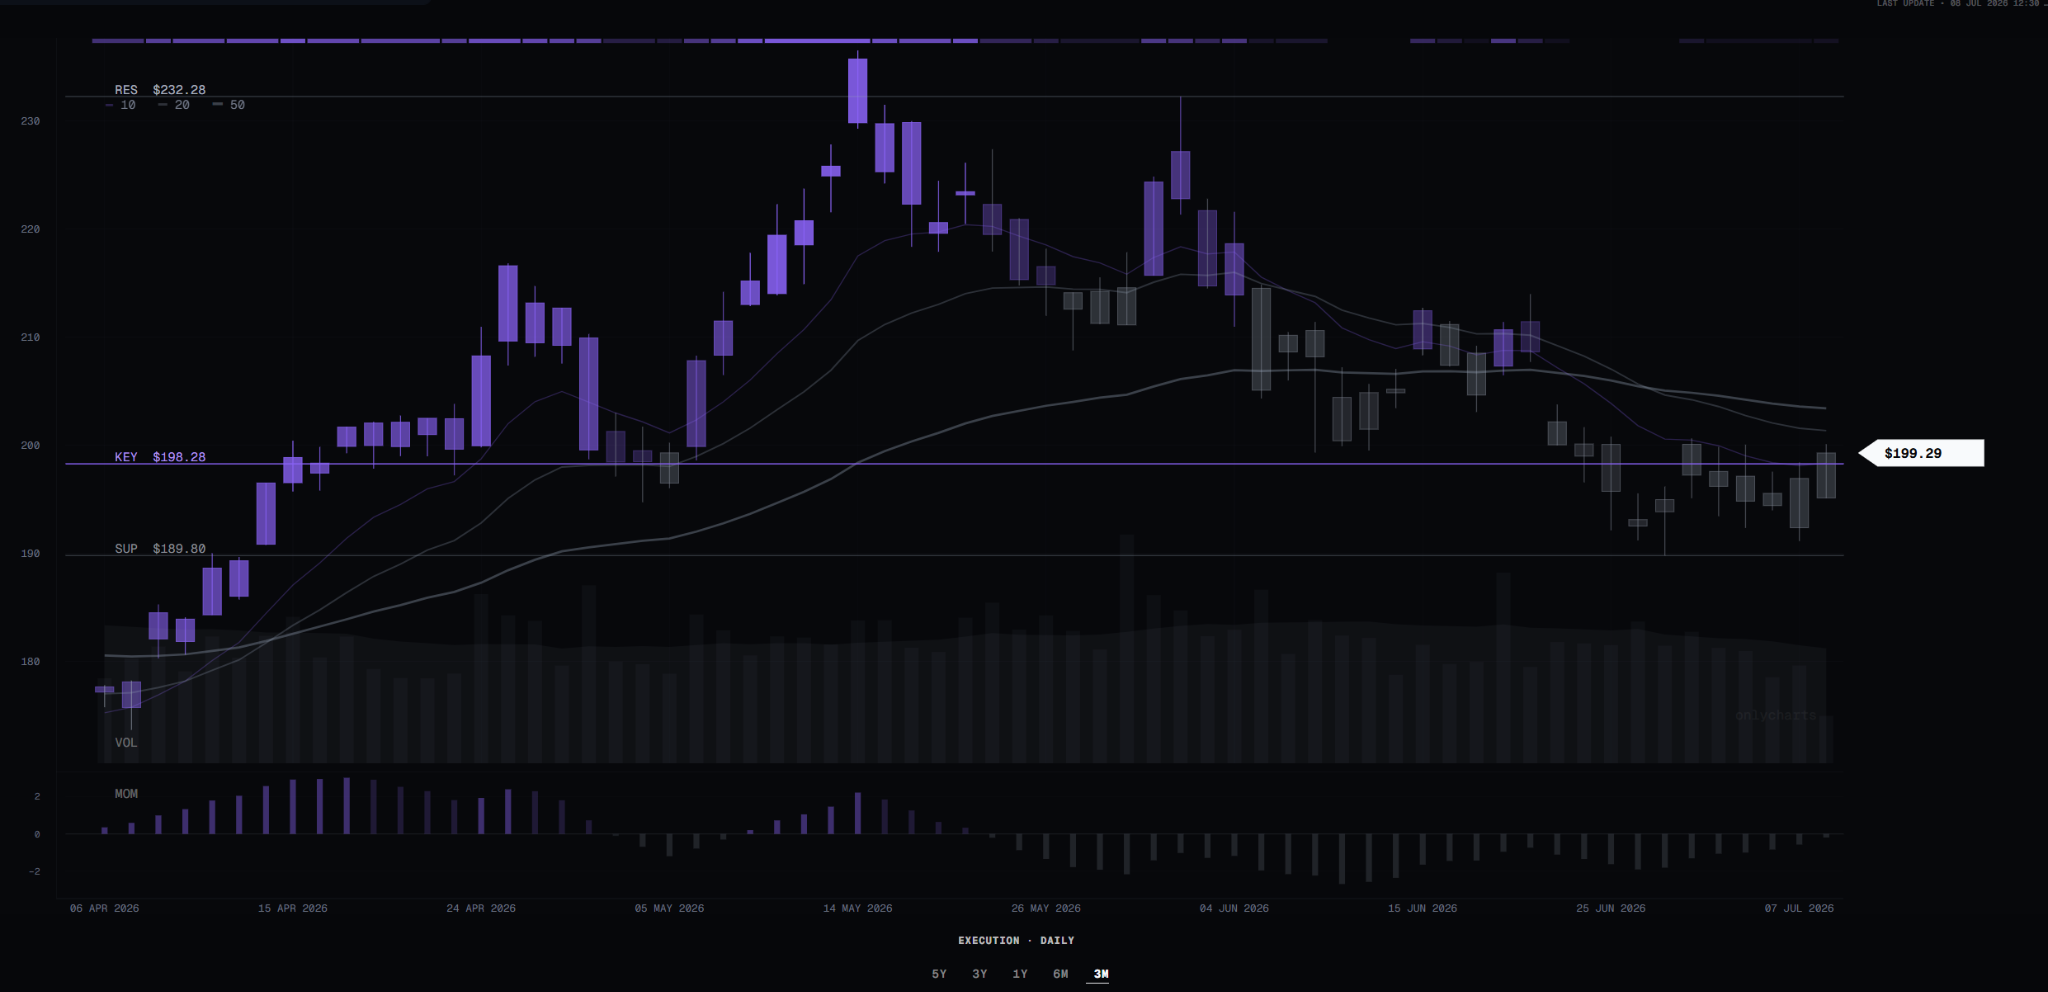
The OnlyCharts Score combines the technical evidence that matters into a single 100-point framework, helping you see whether conviction is building or fading.
Price relationship versus the 10, 20 and 50 trend rails.
MACD behaviour and whether pressure is improving or weakening.
Stock performance versus the relevant market benchmark.
Participation, buying pressure and whether the move has support.
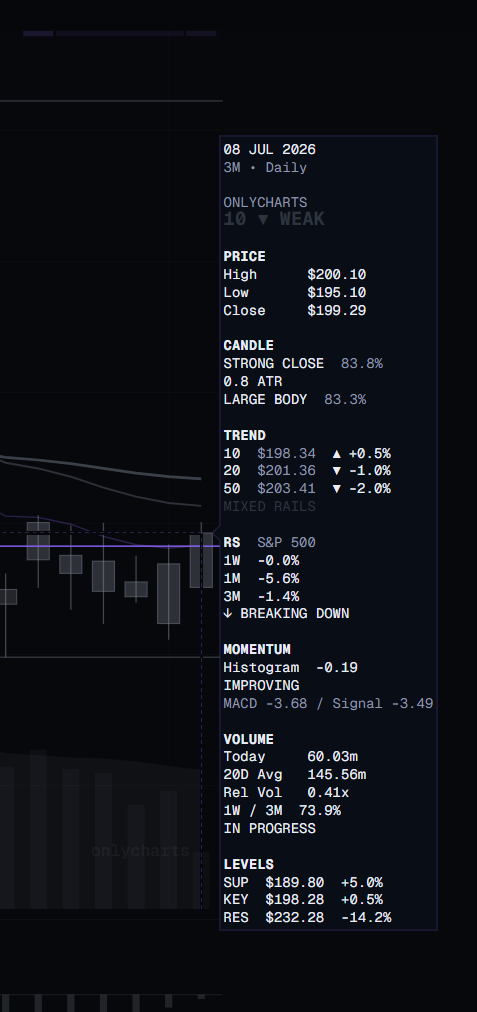
Hover over any candle and instantly see the data behind the move: price action, trend, relative strength, momentum, volume and key levels.
A serious UK small-cap investor may look through dozens of stocks at a time. OnlyCharts is built to make that review faster and more consistent.
Start with the stock you want to review.
See technical health in one clean view.
Use the score and structure to judge quality.
Know whether it deserves deeper research.
Built for clarity, speed, consistency and confidence. No price targets. No stock tips. Just a faster way to understand what the chart is saying.